
 |
 |
 |
BitScope Chart is a multi-channel waveform data acquisition and chart recording application.
Unlike other data acquisition systems Chart is very high bandwidth and leverages the power of WaveMeter to capture, display and record AC or DC voltages, frequencies, periods and other signal statistics on multiple channels.
Features and benefits include:
Anything WaveMeter can measure Chart can plot in real-time and record to disk. Any combination of BitScope channels may be used including logic channels for time interval, frequency, period and duty cycle measurements.
BitScope Chart can capture waveforms utilizing the full bandwidth of BitScope.
This means signals from DC to very high frequency RF can be captured, analyzed and the signal statistics displayed and recorded as they evolve over time. The raw data may be recorded as well.
Chart is just as well suited to plotting the RF power of a radio transmitter as it is monitoring the operation of a power inverter or recording a slow charge voltage profile of a battery.
For example these six plots show the output level variations as frequency is swept over each range of a cheap RF signal generator driving a 50Ω load.
These ranges start at 100kHz and finish at 150MHz and exhibit some substantial output level variation.
The highest range is unable to drive the load adequately but it also shows the upper bound of the analysis band. The point is that any signal that can be measured via voltages or waveform statistics that is within the bandwidth of BitScope is suitable for capture with Chart.
With appropriate sensors or probes measurement and data logging may include AC/DC voltages, current, power, frequency, temperature, humidity, pressure, phase and duty cycle.
Statistics are evaluated continuously so you can see them at any time and any combination of them may be recorded to disk. Changes may be made to a channel without pausing the other channels.

Operation is automatic, just click the RUN button or the keyboard spacebar.
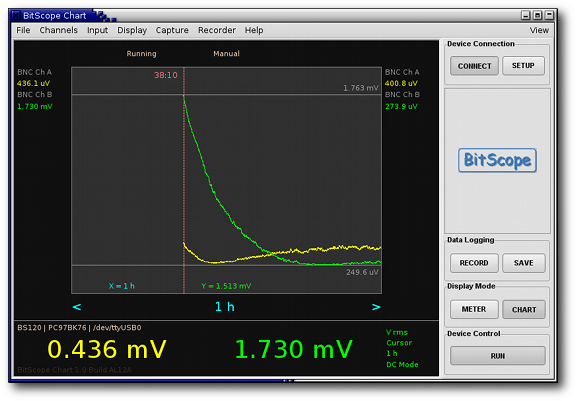
Chart uses a single window as shown in the screenshot at the top of this page.
Like WaveMeter the application window comprises three main sections:
Down the sides of the main display are the live capture measurements (on the right) and cursor time measurements (on the left) for each enabled channel.
The example on the right shows 8 frequencies generated by a simple counter (WaveLoop 0). The first channel (POD Ch A) is the WavePOD analog output frequency and the logic channels show the associated address line frequencies.
Any of these measurements may be clicked to select the channel for solo mode or to select it to see the waveform. The cursor may be dragged to any position to view measurements made in the past while live measurements continue.
Below the display are the channel measurements and the primary chart controls.
For each channel a selected waveform statistic is displayed in a large font to make reading values from far away easy (e.g. while probing around a circuit).
Shown with the channel measurements is information about the connected BitScope (a BS120U on the first USB port in this example) as well as the Chart version as seen here:

To the right of the measurements are four primary chart controls which in this case select the signal parameter (Vrms), whether to display the live or cursor data (Cursor), the time duration over which to capture (1 hour) and whether to display voltages DC or AC referenced.
Advanced controls and application configuration options are available via the menus at the top of the application window and almost all operations have keyboard short-cuts available.

BitScope Chart inherits the sophisticated real-time signal analysis of WaveMeter.
This means that in addition to the raw input voltages, Chart can measure, plot and record the following waveform statistics:
Chart repeatedly calculates all the statistics each capture frame and adjusts the analog input ranges, voltage scaling and sample rates to optimize the measurements.

While capturing and plotting waveform statistics, Chart can also be configured to save previously recorded statistics or log these data live as they are evaluated.
The raw input data from each channel may also be recorded if required.
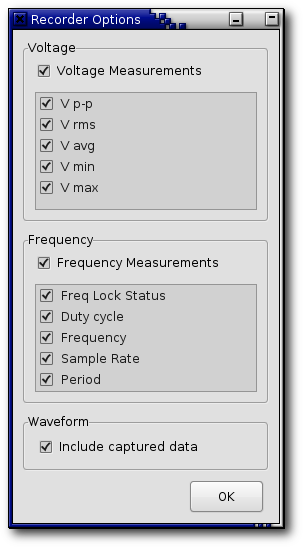
The recording options dialog shown here selects of which signal statistics are to be recorded to disk during capture.
Statistics selection is divided into three sets: voltage, frequency and waveform. Normally the raw waveform data is not recorded as it can produce very large data sets.
Recordings are saved in the standard CSV format and are suitable for import into most spreadsheets and many other numerical analysis or database applications.
Statistics are recorded for all channels that have been enabled regardless of whether they are shown on the chart display.
In normal usage Chart operates without the need for any special setup or configuration but sometimes it may be necessary tweak some settings to optimize measurements.
For example, it may be desirable to choose the sample rate at which to capture or adjust the amount of frame averaging to be applied to slow changing statistics to reduce noise.
Most configuration options are selected via the main menus at the top of the window but some are available by right-clicking various widgets on the display.
Chart can also be used to (re)calibrate the connected BitScope when required. Online help is available via the main menu.
Chart supports all current BitScopes and old models back to BS300S (since 2003).
Like most other BitScope software, Chart is cross-platform compatible with Windows 8 and 7 as as well most popular Linux distributions such as Debian, Ubuntu, Fedora, RedHat and Novell.