Many virtual instruments are dual timebase where the scale of each timebase is zoomable.
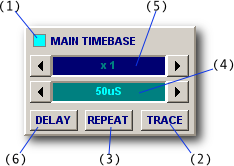
The MAIN TIMEBASE panel is where the primary timebase and associated timebase zoom are controlled. The DELAY TIMEBASE (i.e. secondary timebase) appears on the delay panel but its zoom factor is accessed here (i.e. on the main timebase panel).

The main timebase panel sets the display time scale in seconds per division for both analog and logic signals.
It is also where the primary capture buttons are located.
The Timebase LED (1) lights up when the main timebase is active; it turns off when the delay is selected.
TRACE (2) initiates one-shot waveform capture.
REPEAT (3) initiates repeating capture.
The Timebase (4) parameter sets the timebase value.
The Zoom (5) parameter sets time (zoom) scale factor.
DELAY (6) enables the delay timebase for alternate/delay timebase control.
The TRACE and REPEAT buttons are at the heart of all virtual instrument operations.

Clicking TRACE initiates a single mixed signal waveform capture or advances waveform replay by one frame and displays the result.
When a trigger is seen the waveform is displayed and may be inspected in detail using timebase zoom, waveform offset, channel scale and offset (but not range) and cursors can be used to measure waveforms.
Auto trigger can be used with TRACE. It guarantees capture will occur after a finite period of time. However when looking at intermittent signals it is usually best to disable auto trigger (so capture occurs only when a trigger is caused by the waveform itself).
The REPEAT button initiates a repeating TRACE at a specified frame rate. In this case, the auto trigger can be very useful, especially if the signal source unknown.
Capture can be terminated at any time by clicking up the REPEAT or TRACE button.
However there's a difference between these options:
It is also important to understand that as soon as TRACE or REPEAT is clicked to commence a new capture, any waveform previously displayed will be overwritten immediately (unless the recorder is running). This is because BitScope uses the same buffer to capture signals immediately; it does not wait for a trigger to be seen (otherwise signals before the trigger could not be captured).
The rate at which REPEAT capture and display updates proceed is called the frame rate.

It also sets the auto trigger timeout (as frame period x 2).
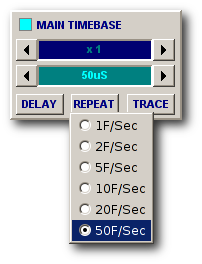
The frame rate is changed by right-clicking the REPEAT button to pop up the menu. Whether DSO actually updates at this rate depends on a range of factors:
When run on a modern PC with a 1GHz or greater speed CPU, even with modest graphics cards, the maximum display refresh rate can typically reach 50Hz or beyond.
Even low cost Netbooks are usually capable of this.
However on older PCs or where the link speed is slow (eg, when connected to a Network BitScope via a limited bandwidth Internet connection) or run on a very high resolution display, the frame rate may be lower (for example connecting to SYDNEY).
If the frame rate is very slow it may also be necessary to lower the selected frame rate if the auto trigger is enabled (to avoid premature auto trigger timeouts and/or missed triggers).
The main timebase sets the time per division like most oscilloscopes.

The timebase value is changed by clicking the buttons on the left and right of the parameter or by right-clicking to pop-up and menu to jump directly to a different value.
The timebase may also be clicked to toggle between the most recently used values, which allows quick comparisons to be made between two settings.
Timebase implicitly sets the capture sample rate; for a given timebase DSO always trys to use the highest sample rate it can based on the current buffer size to maximize the available non- interpolating timebase zoom and capture waveforms with the highest possible resolution.
All BitScopes can capture far more data than can be shown on the display at once.
Timebase zoom takes advantage of this and allows one to zoom in on fine waveform details or zoom out to see an overview of the entire waveform on screen all at once.

The zoom is changed by clicking the buttons on the left and right of the parameter or by right-clicking to pop-up and menu to jump directly to a different value.
Most virtual instruments scale the display to show half the total capture buffer. When set other than x1 the parameter lights up and this ratio changes.
For example at x10 the timebase is zoomed by a factor of 10 resulting in a zoomed timebase of 5 uS/Div (assuming a timebase setting of 50 uS/Div).
![Fig [1] - Timebase (Grid On) Fig [1] - Timebase (Grid On)](/software/dso/guide/2.2/54.png?m=p)
Fig [1]
The timebase including the zoom is shown at the bottom of the display as shown in Fig [1]. Whatever combination of timebase (main or delay) and zoom is used, the resulting timebase displayed is always shown at the bottom of the display.
![Fig [2] - Timebase (Grid Off) Fig [2] - Timebase (Grid Off)](/software/dso/guide/2.2/55.png?m=p)
Fig [2]
Note also that if the main display grid is disabled (so there are no divisions shown) the timebase value (shown on the display) switches to report time per display instead of time per division.
Fig [2] shows this as 50 uS in this example because the time per division is 5 uS and there are normally 10 divisions per display. The values shown for timebase and zoom parameters themselves do not change however.
The other effect of timebase zoom is the width of the waveform offset slider. In this example its width is 1/2 x 1/10 = 1/20th of the display width, indicating that for a zoom of x10 one can scroll the waveform left and right a total of 20 times the display width.
DSO can scroll a captured waveform to a convenient location on the display.
Together with timebase zoom, offset allows one to choose which part of a captured waveform or logic to view and in how much detail. Scrolling the waveform means to apply a time offset:
![Fig [3] - Waveform Offset Control Fig [3] - Waveform Offset Control](/software/dso/guide/2.2/32.gif?m=p)
Waveform Offset Control [3]
The slider below the display can adjust the offset dynamically, in this case from 0 uS to 90 uS.
The offset itself is reported (as TD =) next to the timebase value at the bottom of the display.
If the delay timebase is also enabled, the value reported is the sum of the post-trigger delay and the offset. If a non-zero pre-trigger is selected, the value reported may be negative.
When a feature has been located to the center of the display it can be zoomed:
![Fig [4] - Zoomed Waveform Offset Fig [4] - Zoomed Waveform Offset](/software/dso/guide/2.2/33.png?m=p)
Zoomed Waveform Offset [4]
Fig [4] shows the same waveform as Fig [5] but timebase zoom set to x50.
However, in this case the waveform offset is reported -5 uS because the left edge of the display is 5 uS before the trigger point (which is the rising edge in the middle of the display in this example).
The zoom can be increased as far as x500 on some BitScope models (e.g. BS325) which is in fact a scale of 1000 relative to the entire capture buffer (the display shows 1/2 the buffer at x1).
If the capture sample rate is high enough and the buffer size large enough, the timescale can be reduced without any data loss or interpolation and without requiring recapture.