Most DSO instruments are dual timebase where the scale of each timebase is also "zoomable".
The MAIN TIMEBASE panel is where you set the main timebase and adjust the timebase zoom and is described here. The DELAY TIMEBASE (ie second timebase) appears on the delay panel but its zoom factor is controlled from the main timebase panel (when selected) as well.

The main timebase panel sets the "seconds per division" used to display waveform and logic on the main display.
It is also where the TRACE/REPEAT buttons that initiate capture are located.
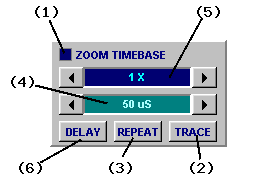
(1) Timebase LED illuminates when the main timebase is selected.
(2) TRACE Button initiates data capture.
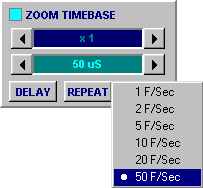
(3) REPEAT Button selects repeating capture. Also sets the (maximum) display frame rate.
(4) Timebase Control sets the timebase value in "seconds per division".
(5) Zoom Control sets timebase scaling factor (aka "timebase zoom factor").
(6) Delay Button enables the delay timebase for alternate/delay timebase control.
The TRACE and REPEAT buttons are at the heart of all DSO instrument operations.
Clicking the TRACE button initiates a single ("one-shot") mixed signal data capture or DDR replay.
Once captured the waveform and logic data may be inspected in detail using the timebase zoom and waveform offset. The vertical scaling can be adjusted and cursor measurements made.
Clicking the REPEAT button does the same thing, only this time capture or replay and display is repeated automatically at the selected frame rate.
The auto trigger can also be useful for repeating captures.
Sets fastest possible refresh rate used for repeating capture.
It also sets the AUTO Trigger timeout.

It may be changed by right-clicking the REPEAT button to pop up a menu and select the frame rate directly.
Whether the DSO actually updates the display at this rate depends on a range of factors:
When using a PC with a 400 MHz Pentium II or earlier CPU and/or an older graphics card the maximum display refresh be be limited to below the selectable maximum (50Hz).
If the speed of the link between the PC and BitScope is slow is may also be necessary to slow the frame rate (to avoid premature AUTO trigger timeouts). An example of when this may be necessary is talking to a Network BitScope half way around the planet via the Internet.
The main timebase sets the "time per division", like most oscilloscopes.
The timebase value used for waveforms as displayed is always shown on the display (Fig [2]).
The chosen timebase implicitly sets the sample rate used for data capture; the DSO always trys to use the highest sample rate it can based on the current buffer size to capture waveforms at the selected timebase. This maximizes the non-interpolating Timebase Zoom available.
All BitScopes can capture far more data than can be shown on the display at once.
Timebase Zoom takes advantage of this and allows you to "zoom in" on fine waveform details or "zoom out" to see an overview of the entire waveform on screen all at once.
![Fig [1] - Zoommed Timebase Fig [1] - Zoommed Timebase](/software/dso/guide/1.3/19.png?m=p)
Zoom Timebase [1]
By default most DSO instruments scale the display to show 1/2 of the total capture buffer. When set other than x1 the timebase zoom parameter (5) lights up and this ratio changes.
Fig [1] shows the main timebase zoomed by a factor of x10 resulting in a zoomed timebase of 5 uS/Div.
![Fig [2] - Zoommed Timebase Value Fig [2] - Zoommed Timebase Value](/software/dso/guide/1.3/54.png?m=p)
Timebase Value [2]
The zoomed timebase value is shown at the bottom of the main display for a given capture, in this example shown in Fig [2].
In fact whatever combination of timebase (main or delay) and timebase zoom you choose, the resulting timebase value for a given capture will always been shown at the bottom of the display.
![Fig [3] - Timebase (Grid Off) Fig [3] - Timebase (Grid Off)](/software/dso/guide/1.3/55.png?m=p)
Grid Off [3]
The other point to note is that the waveform offset slider scales in size according to the timebase zoom selected.
In this case its width it is 1/2 x 1/10 = 1/20th of the display width indicating that for timebase zoom of x10 you can scroll the waveform left and right for a total of 20x the display width.
Note also that if you disable the main display grid the timebase value switches to report "time per display" instead of "time per division". Fig [3] shows this as 50uS because the time per division was 5uS and there are 10 divisions per display.
DSO can scroll through the capture buffer to move waveform to where you want it on display.
Together with timebase zoom, waveform offset provide very powerful means by which you can choose which part of a captured waveform or logic trace you want to see and in how much detail.
Scrolling the waveform means to apply a time offset to the waveform:
![Fig [4] - Waveform Offset Control Fig [4] - Waveform Offset Control](/software/dso/guide/1.3/32.png?m=p)
Waveform Offset Control [4]
The scroll bar below the main display is used to adjust the offset that is to be applied (Fig [4]). In this case a 92 uS offset has been applied to locate a rising edge at the middle of the display.
The offset is reported at the lower left edge of the display (shown as TD = 92 uS in this example).
If the delay timebase is enabled, the value reported is the sum of the post-trigger delay and the offset. If a non-zero pre-trigger is selected, the value reported may be negative.
If you need to know precisely how much of the reported value is due to the waveform offset (ie, scroll bar position) you can see this reported as the second value in the delay timebase panel.
When a feature has been located to the center of the display it can be "zoomed".
![Fig [5] - Zoomed Waveform Offset Fig [5] - Zoomed Waveform Offset](/software/dso/guide/1.3/33.png?m=p)
Zoomed Waveform Offset [5]
Fig [5] shows the same waveform as Fig [4] with no change made to the waveform position but the timebase zoom set to x20. The waveform offset is now reported 187 uS which maintains the relative position of the edge at the middle of the display.
The zoom can be increased as far as 50X which is in fact a time scaling of 100 relative to the entire buffer. If the capture sample rate is high enough and the selected buffer size large enough the waveform timescale is reduced without any data loss or interpolation and without requiring recapture (ie, it operates on one-shot captured waveforms).