| Software | BitScope DSO | Online Demo |
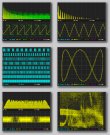
 This animated display export shows a triangle waveforms of slowly increasing frequency. The file that was used to create this example is called triangle.csv in the Ofline Examples. For details about how to play this on your own PC, read the Sydney BitScope page. Assuming you have just (re)started BitScope DSO and loaded this file you should see Channel A playing the same waveform as shown above.  There will be two differences, one obvious and the other more subtle:
To enable the spectrum analyzer and show it split screen with the waveform display as shown above, click the button on the right side of BitScope DSO called BOTH. This is button is one of several display selectors. Together they allow you to select the configuration of the main display and which modes of the current DSO instrument are active at any given time.  Pre-Trigger Control To position the trigger in the middle of the display, click the pre-trigger parameter or right-click and select 25%. This positions the trigger point in the middle of the display. You may think 50% should instead refer to the middle of the display. However pre-trigger refers to the capture buffer not the display. Because the display is 1/2 of the total capture duration (when timebase zoom is set to the default, 1) the middle is 25%. The capture buffer size defaults to two times the display duration to allow waveform offset so you can position what you want to see precisely where you want to see it. Try adjusting the waveform offset now (the slider under the main display) to see its effect. Visit the next page (Mixed Signal) to learn about mixed signal capture. |
Copyright © 2023 BitScope Designs